
Research
An imaging biomarker for inflammation in Type 2 Diabetes
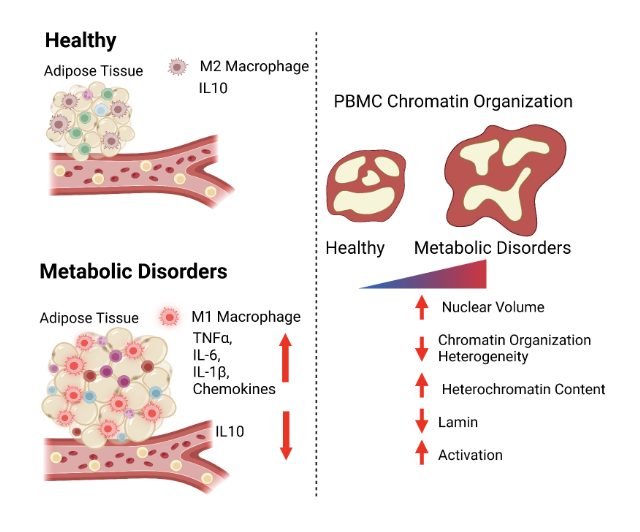
Type 2 Diabetes is accompanied by chronic low-grade inflammation. Adipose tissue shifts toward pro-inflammatory signalling and circulating immune cells respond, but measuring that response normally means a panel of clinical assays. We asked whether it is already written into the chromatin of a patient's peripheral blood mononuclear cells, and visible under a microscope. A representation-learning framework reads chromatin organization from PBMC images, including nuclear volume, heterochromatin content, lamin and the heterogeneity of chromatin packing, and recovers the immune alterations that accompany the disease at 83% accuracy, from a sample that is already routinely drawn.
A 3D in-vitro model of the tumor microenvironment
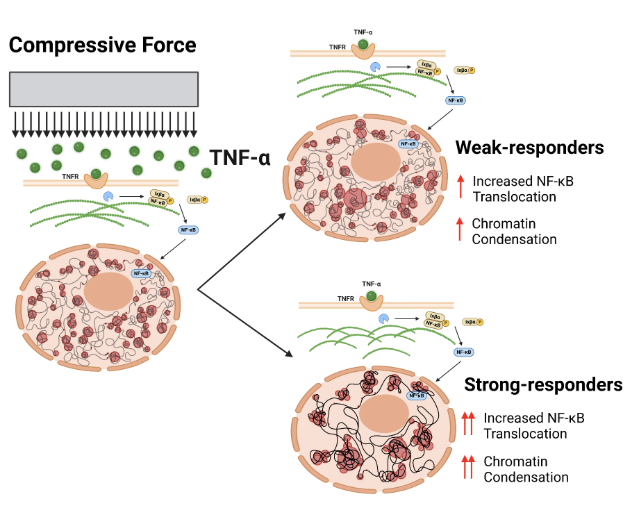
Cells inside a tumor sit in a soft three-dimensional matrix, under mechanical compression and constant inflammatory signalling. A flat culture dish reproduces none of that. I developed a 3D model that embeds cells in a collagen gel and applies both, compressive force together with TNF-α, and used it to ask how an apparently uniform population responds. It splits in two. Nuclear and cell morphology features, combined with machine learning, separate weak from strong responders, distinguished by how far NF-κB (p65) translocates into the nucleus and how much the chromatin condenses. The difference is legible in cell shape alone, before any molecular readout.
Correlative light and soft X-ray tomography of heterochromatin
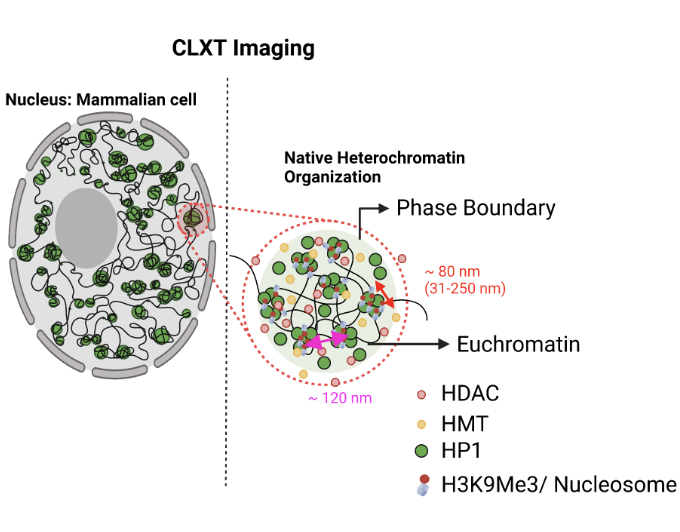
Heterochromatin organization at the mesoscale, between individual nucleosomes and whole chromosome territories, is hard to observe, because the two techniques that could see it are rarely applied to the same cell. I established a framework that registers confocal fluorescence microscopy to synchrotron soft X-ray tomography on intact, vitrified cells, with no sectioning or staining artifacts, along with the computational pipeline to segment and quantify chromatin density from the reconstructed volumes.